Quick Chart Example: Bar Chart
Zachary Lareau, one of the assistant principals of Crow Point High School, implemented an attendance incentive program in this school year. The class with the lowest level of absences wins a class-wide field trip. He wants to create a bar chart to show to his students as they enter the last quarter of the year.
To create the bar chart:
- Zachary logs on to the School view and clicks the Attendance tab.
- He clicks the Daily History side-tab.
- He selects Options > Query and uses the Student Attendance table to select only absences (code A.)
- He then clicks
 and selects Create Quick
Chart to bring up the Quick Chart wizard.
and selects Create Quick
Chart to bring up the Quick Chart wizard. - In Step 1 of the Quick Chart wizard, Zachary selects New report and clicks Next.
- In Step 2 of the wizard, Zachary selects Quick Chart – Bar for the Report Type and Standard Bar Chart for Format and clicks Next.
- In Step 3, Zachary
specifies the data he wants displayed in his chart. He clicks
 in
the Categories (Horizontal
Axis) section to the right of the Group
by field to open
a pick list, and chooses Student
Attendance for the Table
and Code for the Group
by field. He
clicks OK to save his
selections. For the Series
(Legend Entries), Zachary
clicks in the Series
(Legend Entries) section to the right of the Group
by field to open a pick list. Zachary specifies Student for the Table
and Grade Level for the Group
by field. He clicks OK
to save his selections and return to the Field Selection step of the
wizard.
in
the Categories (Horizontal
Axis) section to the right of the Group
by field to open
a pick list, and chooses Student
Attendance for the Table
and Code for the Group
by field. He
clicks OK to save his
selections. For the Series
(Legend Entries), Zachary
clicks in the Series
(Legend Entries) section to the right of the Group
by field to open a pick list. Zachary specifies Student for the Table
and Grade Level for the Group
by field. He clicks OK
to save his selections and return to the Field Selection step of the
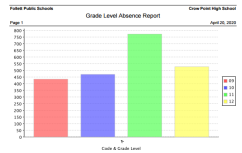
wizard. - In Step 4, Zachary enters Grade Level Absence Report in the Report title field. Zachary uses the default settings for the remaining format options and clicks Next.
- In Step 5 of the Quick Chart wizard, Zachary uses the default values and clicks Finish.
The resulting bar chart appears: